Data Viewer Screen Shots (last updated 11/19/14)
Real Time Weblogic monitoring: Specify your connection data, press start and watch the data come in real time. Useful during troubleshooting sessions.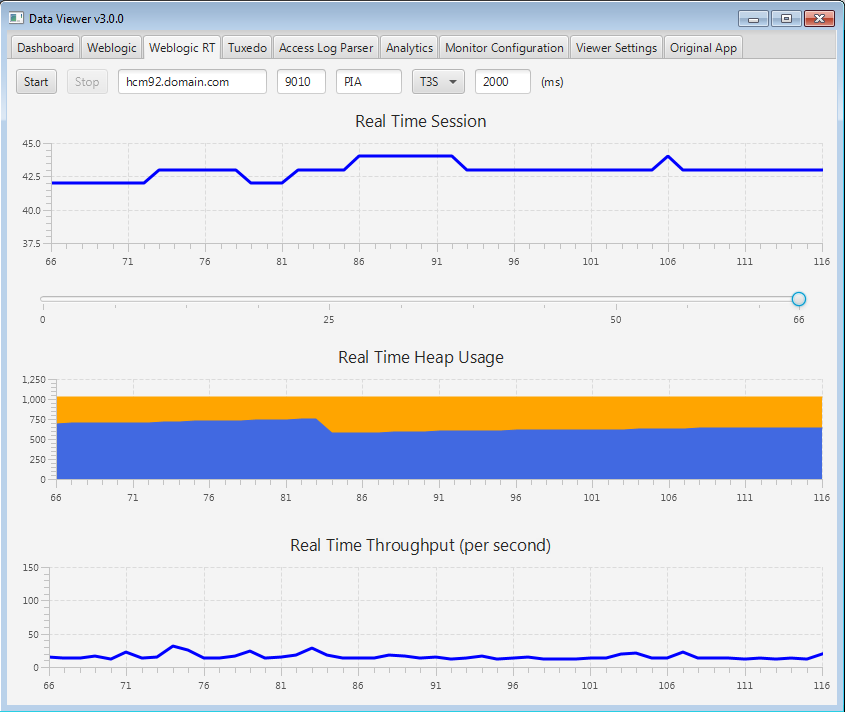 Access Log Parser: Processes the access logs and uses hits on the psc servlet and time taken to calculate a Total Load Time, Avg Load Time, and Hit count Top 5 lists. Produces a bar chart of all components with a Avg Load Time greater that 1 sec. Context menus in the Top 5 Lists allow you to create a scatter graph of page load times plotted by time in the lower left. More features to come with this function I hope.
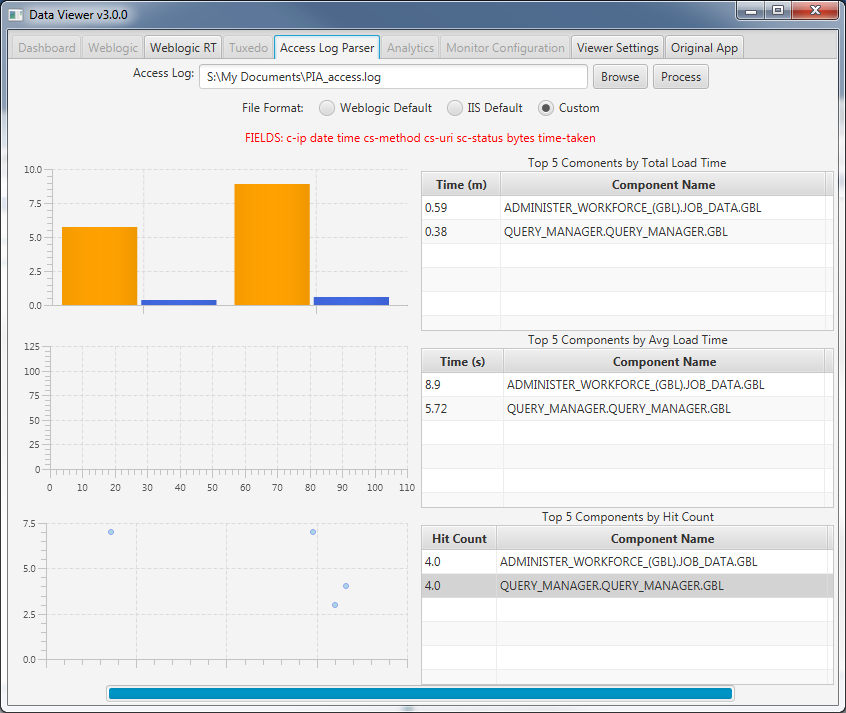 The viewer options for graphing Tuxedo or Weblogic data from the monitor files is now embedded in the last tab (which will be renamed shortly). Here are the currently available options for Tuxedo files.
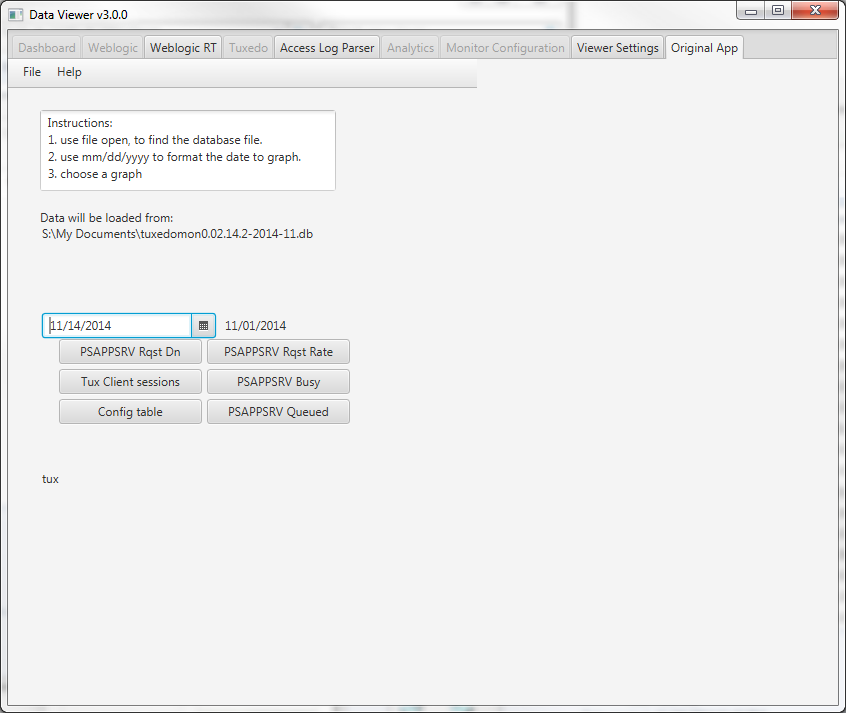 Currently available options for Weblogic Data files.
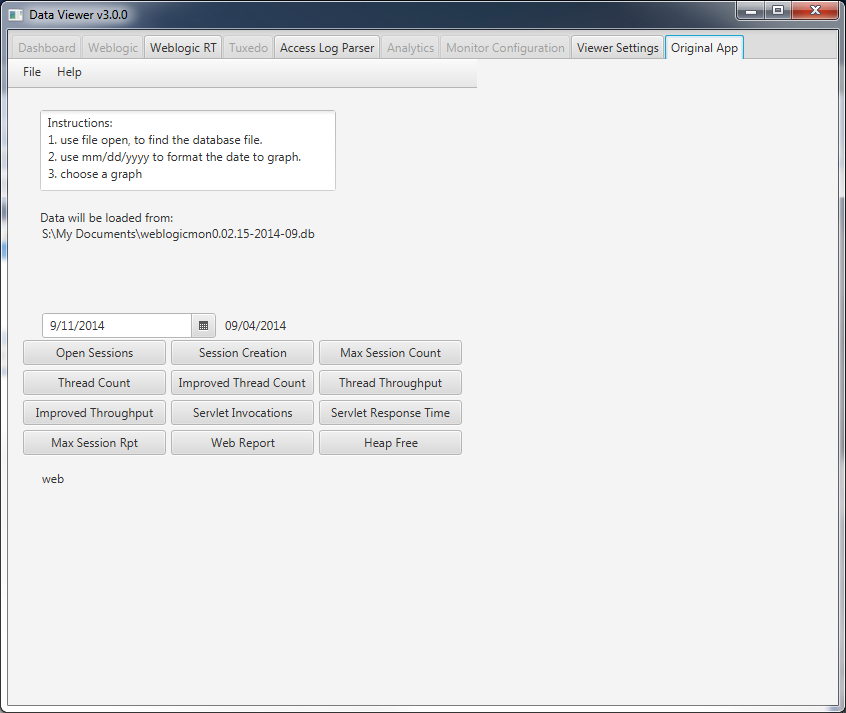 This is the PSAPPSRV Busy chart, It shows how many of the PSAPPSRV processes are not IDLE at the time. If you have five of five busy PSAPPSRV processes you may see Queueing in the PSAPPSRV Queued chart. I did not include a screen shot of the Queued chart. Note: It looks like I forgot to update the title on this graph.
 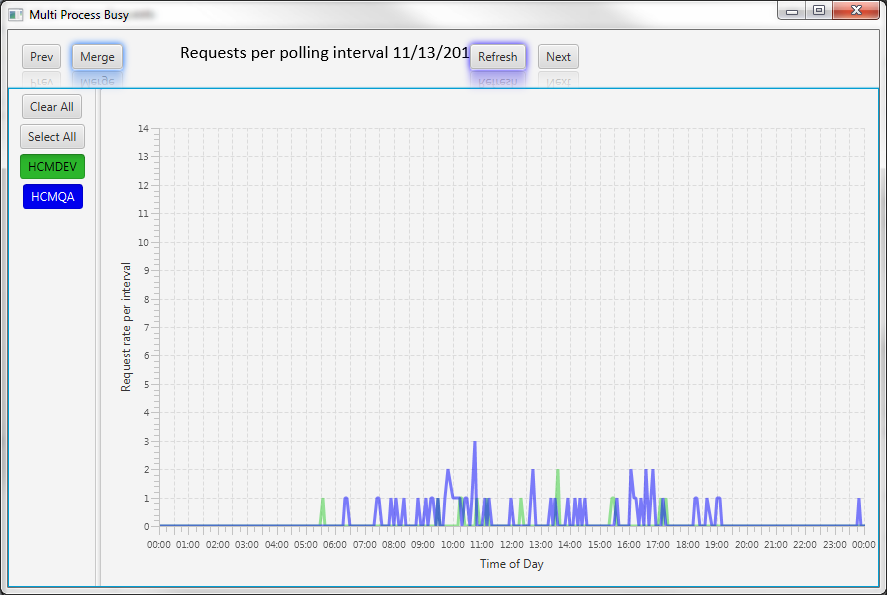 PSAPPSRV Rqst Dn chart: A calculation of the number of requests done over time by PSAPPSRV process. Can easily identify problems with Tuxedo Load Balancing (in theory all your data points should be very close to each other). Can also identify if process failed to restart properly or process spawning/despawning occurrences if your process min/max counts are not set the same. Also can easily see domain restarts. This graph will start at 0 every day unless there is a domain restart at which the restart will be the location of 0.
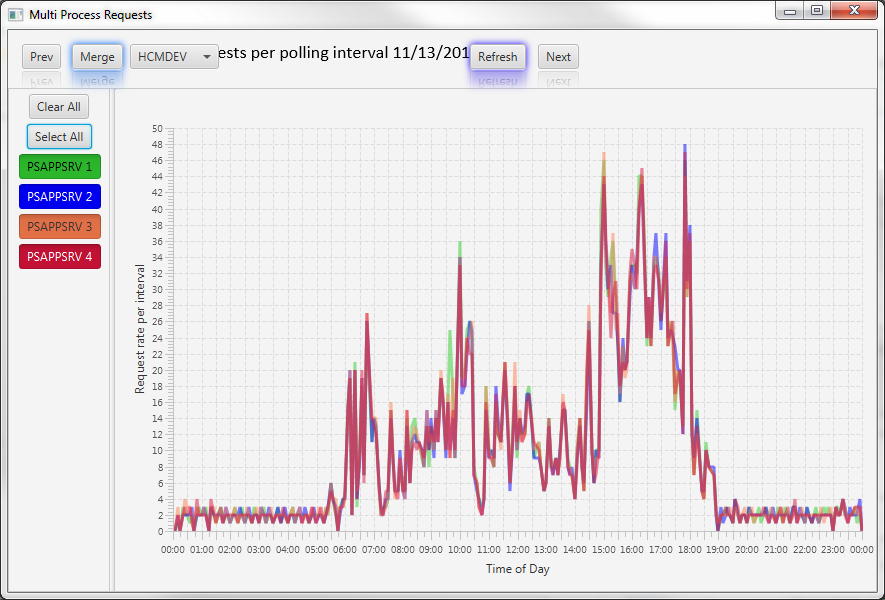
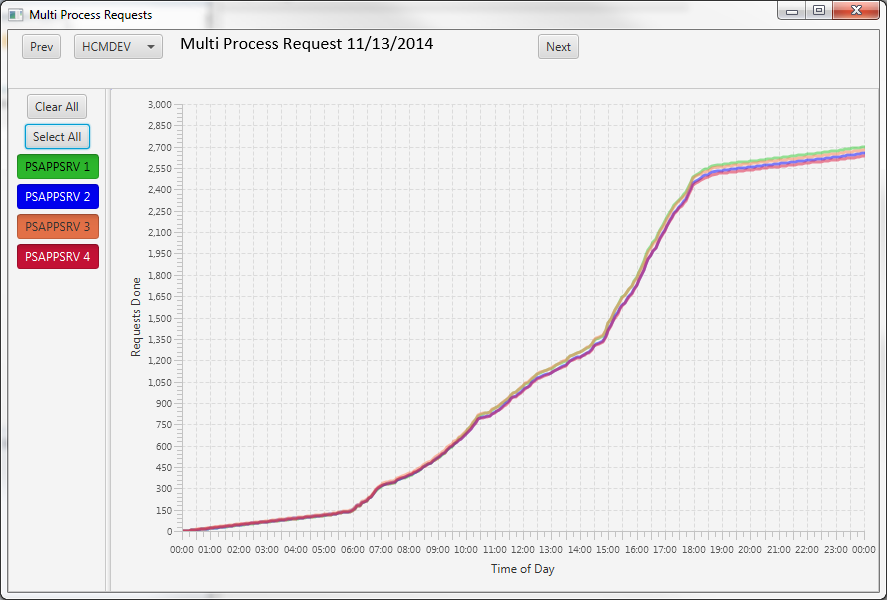 PSAPPSRV Rqst Rate Chart: Another spin on the Request Done chart. This takes the same data and graphs the differences between polling intervals to more easily identify changes in workload over time.
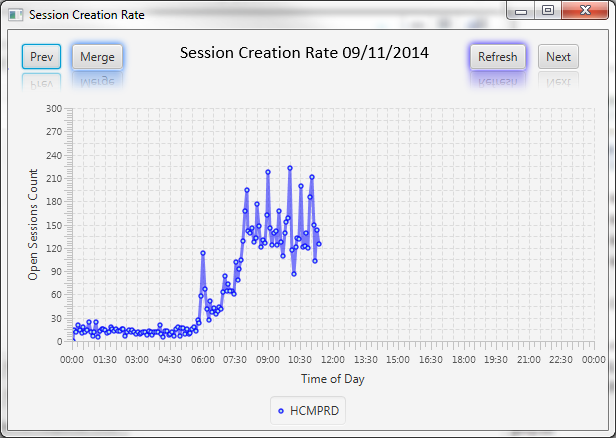
 Weblogic Session Creation Rate Chart: Shows the rate of session creation by polling interval. Same concept as the PSAPPSRV Rqst Rate graph only this one spins the Weblogic open session data into a per interval view.
 An improved Weblogic throughput chart. This corresponds to the throughput measurement in the Admin Console which reports a instant value. This measures the number of requests done that polling interval and calculates a per second throughput rate.
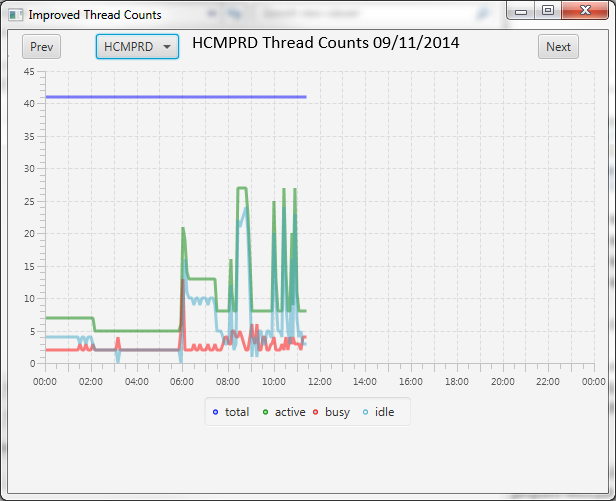
 An improved Thread Count Chart for Weblogic.
 The Weblogic Servlet Response Time chart graphs four lines. The blue line is the avg response time since boot that Weblogic reports for the psp servlet and the red is the avg for the psc servlet. These two lines are long term trends and the longer Weblogic runs the more stable they should be. The green and light blue lines are calculations of the avg response time from the psp and psc servlets respectively over each polling interval.
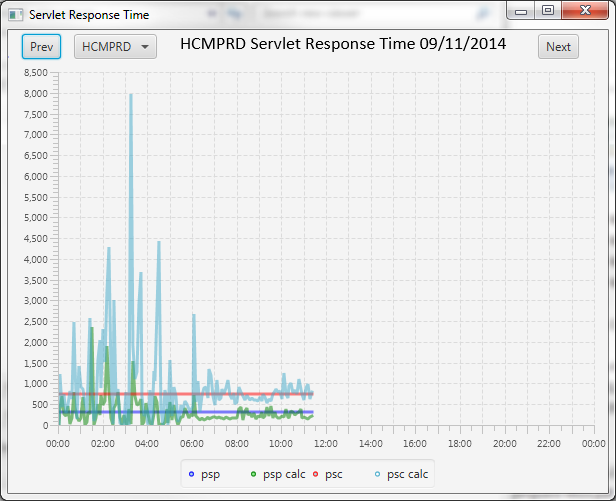
Weblogic Viewer Screen Shots (last updated 5/14/13)

The viewer is a simple tool. It consists of a Main Window which is used to open the file and can set a specific date to graph. It’s pretty simple at this time. When a file is opened it will search for the latest polling time and populate the date field with it.

The Open Sessions Graph displays the current Open Sessions currently existing in Weblogic and display all your environments/servers on one graph. All graphs include a Prev and Next button to quickly maneuver between consecutive days. The refresh button can be used to redraw the graph either because you have it open for the current day and would like to draw the next data points or to remove the Merged data line from below.

There is a Merge button which will consolidate all series on the graph into a new additional line. This is useful if all your Weblogic instances are on one server and you’d like to see a total system user count. It’s also useful if you are using load balancing and have the instances managed individually.

The Open Sessions graph also has a mouse hover feature to help you determine the value of the data point at a particular polling.

The Thread Throughput graph displays overall system throughput, the number of idle threads, and the number of hogger threads. This combination of numbers can be used to identify times where the system was under stress and indicate if it was from a surge in activity or certain pages which may perform poorly. A drop down list allows you to change between configured environments/servers.

The Thread Count graph displays the number of Active Threads and the number of Idle Threads. Sometimes if you have a busy server it’s easier to see changes in the in number of idle threads on this graph rather than the Thread Throughput graph. Again a drop down list allows you to change between configured environments/servers.

The Servlet Invocation is useful for heavy IB users. This graph displays the incremental change between the number of invocations a servlet has done per polling interval. It can be used an indicator of the number of request the Integration Gateway is handling. A drop down list allows you to change between gateway connector types.

The Heap Free graph displays the % of Heap free for the JVM, nothing fancy here. This graph is better displayed wide.

The Web Report displays occurrences of the Weblogic Queue length exceeding 0. This is an indication of a backlog at Weblogic. They shouldn’t occur very often so as a graph it’s not very beneficial, therefor, we report the data in more of a standard report form.
App Viewer Screen Shots (last updated 5/14/13)

This is a prototype of a more advanced Viewer I’m working on as part of the Application/Tuxedo monitoring component. Eventually, the Weblogic Viewer and anything that may be added in the future would most likely be consolidated into a single viewing tool for everything. This one is still a work in progress as of now though.
Leave a Reply